Timeline Report
The Timeline projection in the program uses average times for each stage to be completed. These timeline data is included in the system in monthly update, and may change as a country's policies change, or as the data becomes more refined. You can also specify the average number of years for completion of stages of the application in the Timeline Settings. These user-defined averages can also be entered for any selected countries, to be used in place of system numbers.
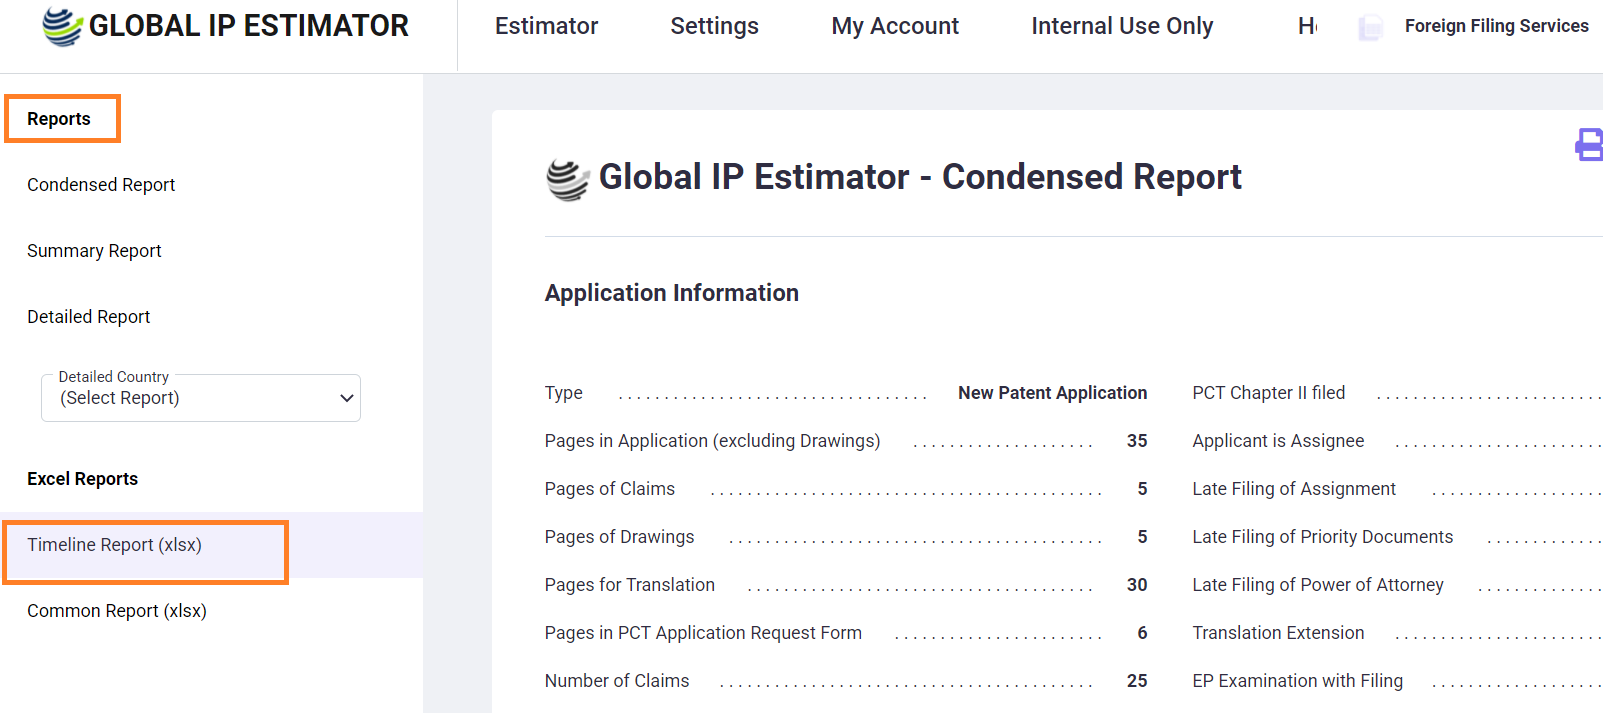
Clicking on the Timeline Report option on the left side of the Reports screen will download a Timeline Excel Report having cost allocated to specific years for all countries by stage, category, country totals and running totals, based on the system defined timelines/defined under Timeline Settings. This report is thus useful for budgeting future costs.
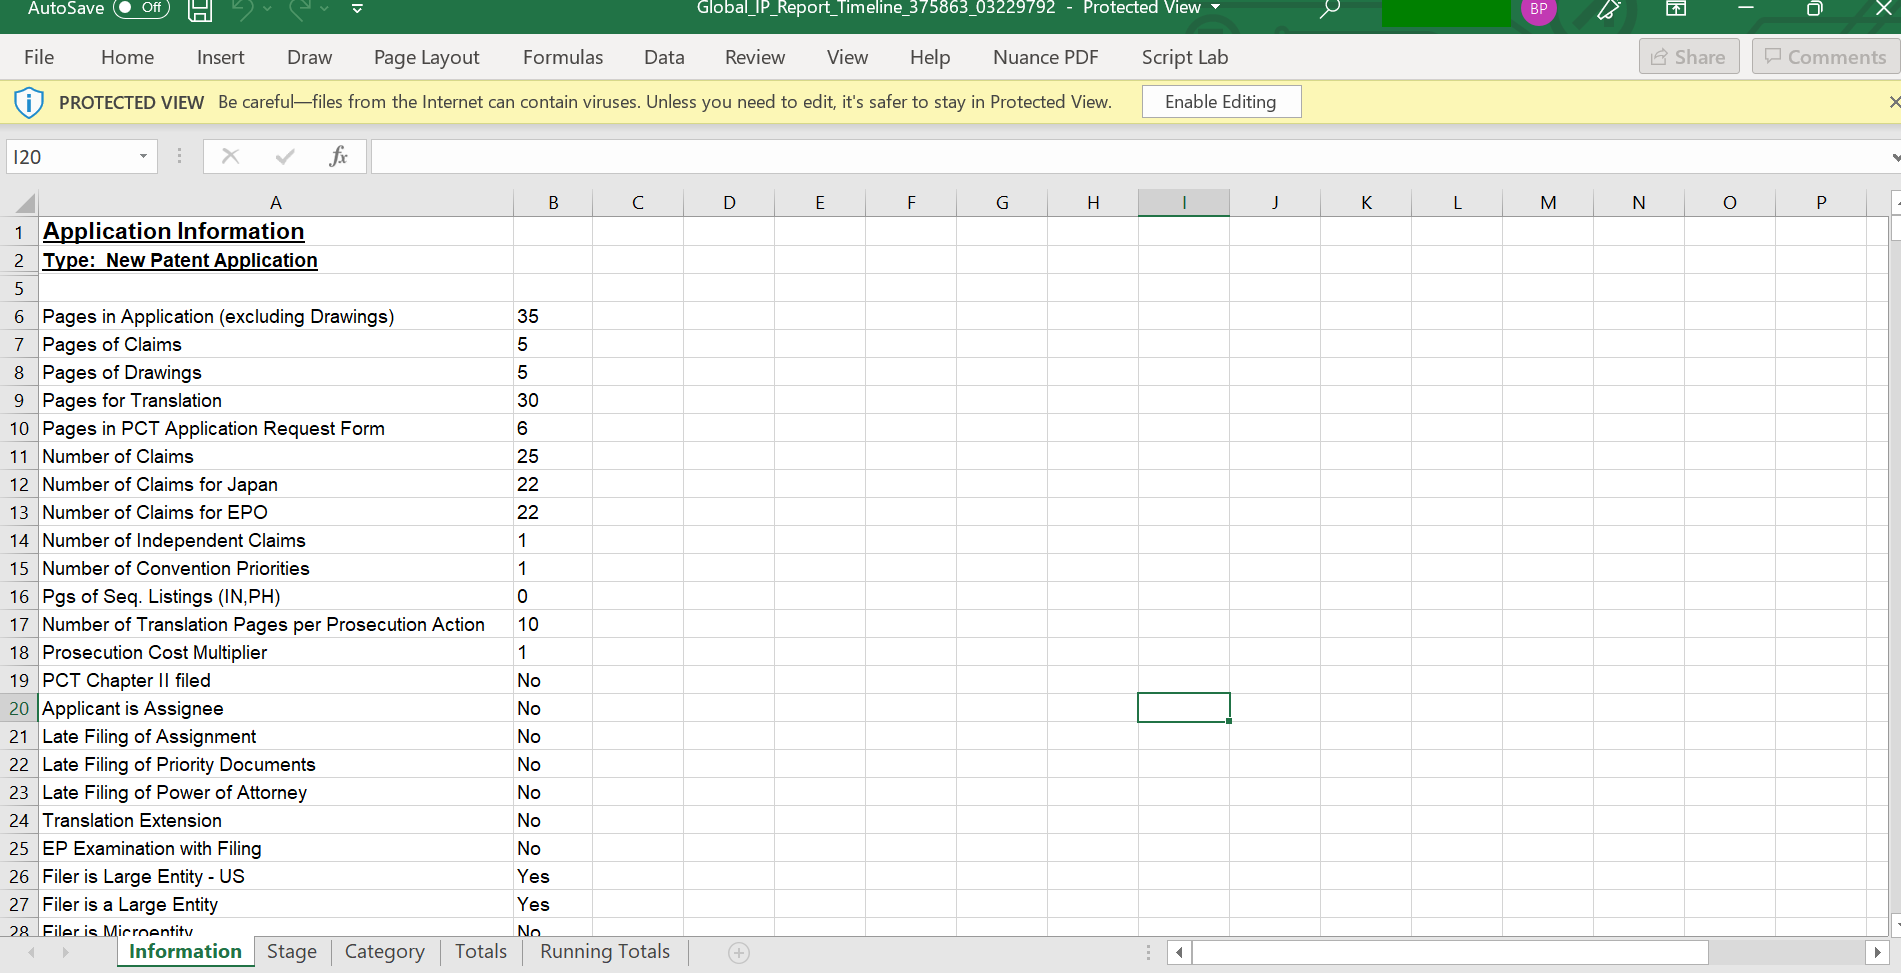
The first spreadsheet of the Timeline Excel Report is the Information spreadsheet, which has Application Information and the Report Dates selected during the run, and the 'User Discount Rates' defined under the Timeline Settings.
The calculations are saved to four Excel spreadsheets: Stage, Category, Totals and Running Totals.
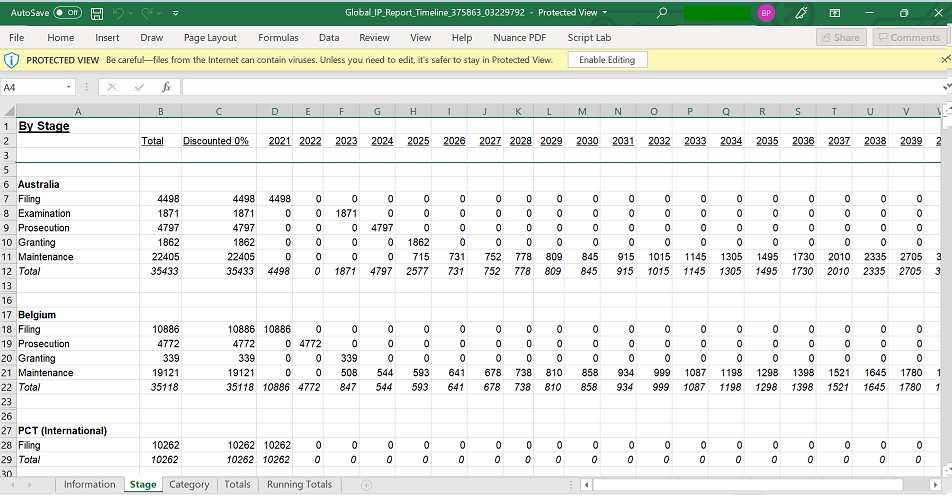
Stage: This spreadsheet is with the costs separated into stages (Filing, Examination, Grant for Patents) for each country and allocated to specific years.
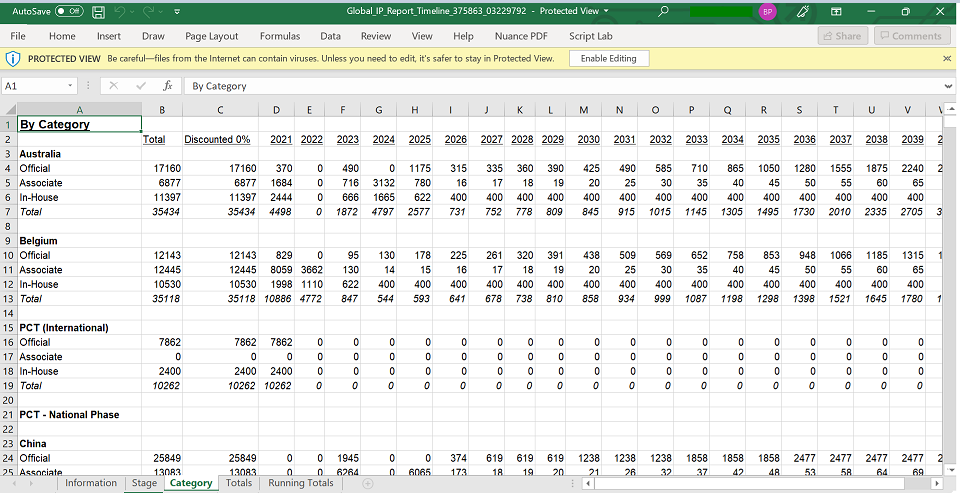
Category: This spreadsheet is with costs separated into categories (Official, Associate, In-House and Miscellaneous) for each country and allocated to specific years.
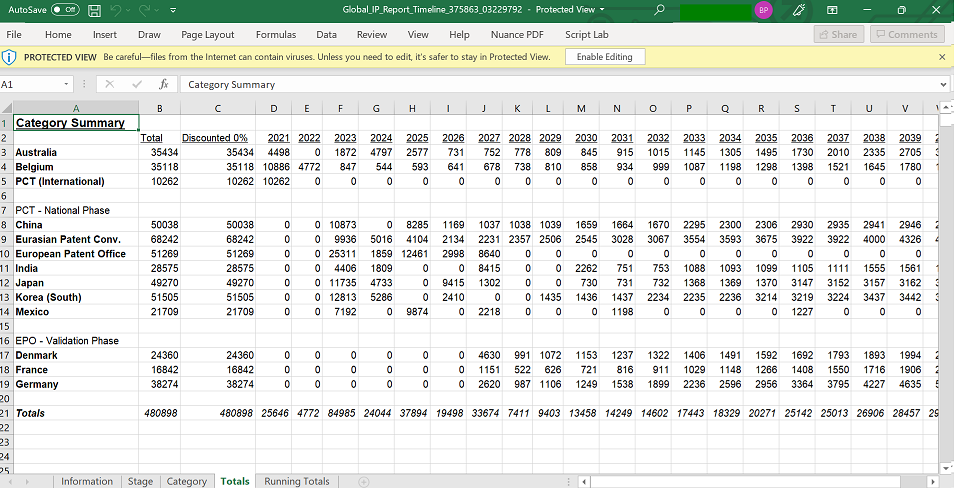
Totals: This spreadsheet is the one with the totals for each country allocated to specific years.
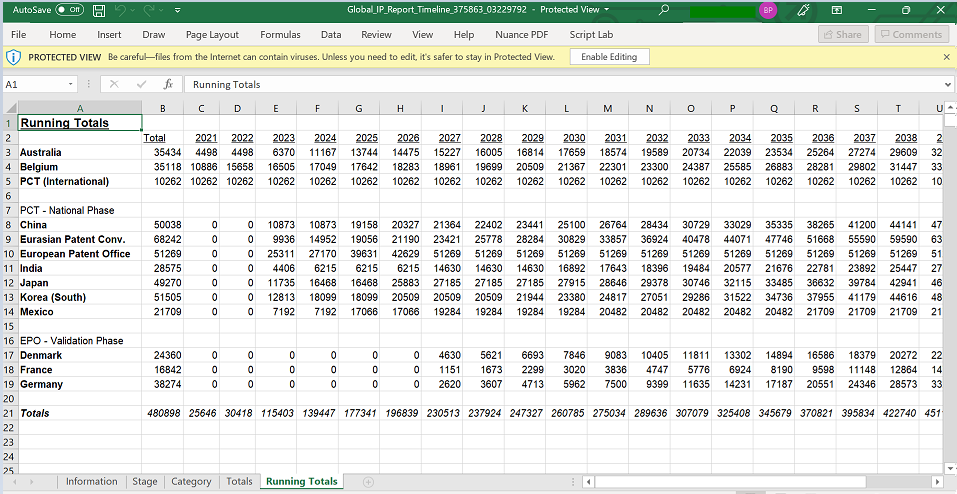
Running Totals: This spreadsheet is the one with running totals, showing the cumulative amounts paid for a country up to a specific year and the cumulative totals for all countries up to specific years showing up at the bottom.